
Joshua Woodruff
Optimized Financial Systems
jwoodruff@optimizedfinancialsystems.com
I’m not an out-of-touch Chicago-based columnist, or a former great that has a hard time accepting the greatness of today’s players. I am a middle-aged sports enthusiast, a poor writer, and an analytics expert. I have the unsexy job of applying math to everyday problems. Today, I felt that I wanted to raise a point that has not been discussed regarding the Warriors.
Even if you have had a hard time believing that Steph Curry is competitive, even though he seems to be enjoying himself, 73 wins should be enough evidence to help you update your beliefs on his competitiveness.
It all started last year, when Matt Winick retired. Who is Matt Winick? He was the man who created the NBA schedule by hand and later on a spreadsheet for the NBA for 30 years. His retirement allowed Commissioner Adam Silver to add another weapon to his war on injuries.
Winick’s retirement opened the door for the NBA to employ analytics to generate their schedules. You may have missed it, but analytics have been in the news everywhere. Sports teams are using analytics to figure out their drafts, or that three-point shots are worth more than two-point shots. That sort of information comes from applying probability and statistics to the data and coming up with new insights.
These types of analytics fall into the groups of descriptive and predictive analytics. They tell you what happened or what should happen if you do something. That information was important as the NBA went to automating the schedule generation. The information gathered said that playing in back-to-back games was correlated with injury, that playing a fresh team against a tired team gave the fresh team an advantage, and gave several other insights into what causes injuries and what made for a competitive game.
What they did next is what I like the most. They employed another type of analytics, Optimization or prescriptive analytics, to generate the 2015-2016 schedule. This scheduling optimization likely employed one or more techniques to generate a schedule that was both competitive and reduced the wear and tear on the players. Mathematical Optimization is a field of analytics that seeks to make recommendations on the best action possible. It can help you figure out your fantasy football draft, make a Roth conversion, determine the best course of treatment for cancer, or make a supply chain more efficient. There are many applications.
The chart below shows the different types of analytics measured against the degree of complexity to the competitive advantage. Commissioner Adam Silver employed this to ensure better NBA games by preventing injuries and reducing the number of unfair match ups.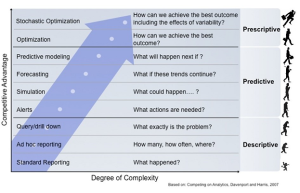
To generate a new schedule, there are 1,230 games to schedule each year. Each team has 41 home and 41 away games, and somewhere between 45 and 85 days when their home arena is available. The trick is to schedule each team so as to avoid long road trips, a densely-packed games, have more weekend games, make the games competitive, and several other criteria for a “good” schedule. The two aspects that are most important here are limiting fatigue, and competitive games. The league lowered the level of fatigue by lowering the number of back-to-back games and four games in five nights among other things. To make games competitive, the NBA tried to make sure that if a team was playing tired, i.e. on the second game of a back-to-back, so was their opponent.
What does this have to do with the Warriors? The Warriors were the beneficiaries of better scheduling (not unfair—just better). It allowed the best to rise to the top. The Warriors had 19 back-to-back games, and no four games in five nights sequence. By this measure, the 1995-1996 Bulls had a slightly harder schedule with 21 back-to-back games and one four games in five nights stretch. It is not much of a difference, but neither is the difference between 72 wins and 73 wins. Matt Winick’s scheduling prowess was close, but it was still improved on by prescriptive analytics (mathematical optimization). It is impressive that Mr. Winick came close to the optimal solution without analytics, but those small differences add up over a season and over a career.
The upshot is that the good teams this year had no excuse for losing to the bad teams. It is why the Spurs have also been doing so well and why the Lakers have had their worst season ever. So if you want to debate whether or not the 1995-1996 Bulls are better than the 2015-2016 Warriors, the scheduling is something you can point to and say, “but if the Bulls had had better scheduling…”